Does it matter which model for sulphide saturation of silicate melt is chosen for calculations?
If you are interested in modelling sulphide immiscibility, then read on! This presentation discusses implications of choosing different models that predict sulphide saturation and the compositions of immiscible sulphide melt.
MODELS

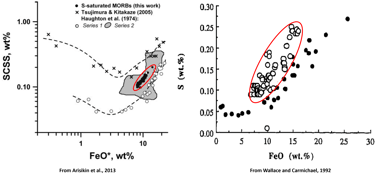
Figure 1. The relationship between Fe and S contents of sulphide-saturated experiments and MORB glasses that is commonly used to demonstrate the effect of Fe on sulphide saturation in silicate magmas. Red ellipses highlight the compositions of MORB glasses.
In this presentation, a suite of sulphide-saturated MORB glasses from Ariskin et al. (2013; their Table A2) is used to illustrate differences between sulphide saturation models available in Petrolog4.
It has long been recognised that the Fe content of silicate melts has a strong effect on sulphide solubility. This relationship between Fe and S contents in silicate melts is often illustrated using the compositions of mid-ocean ridge basalt (MORB) glasses that commonly contain globules of immiscible sulphides which is used as evidence of sulphide saturation (Fig. 1).
Melt crystallisation trend displayed by the selected suite of MORB glasses
In this presentation, a suite of sulphide-saturated MORB glasses from Ariskin et al. (2013; their Table A2) is used to illustrate differences between sulphide saturation models available in Petrolog4.
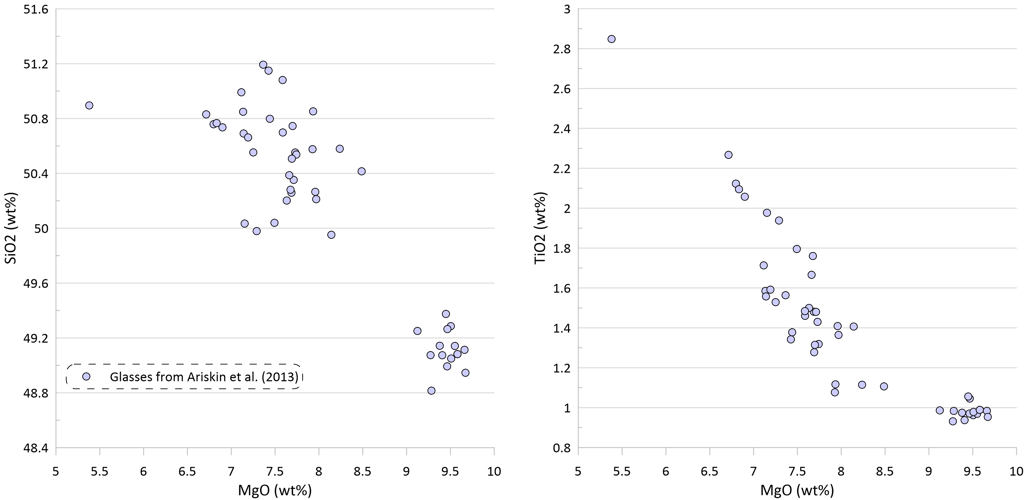
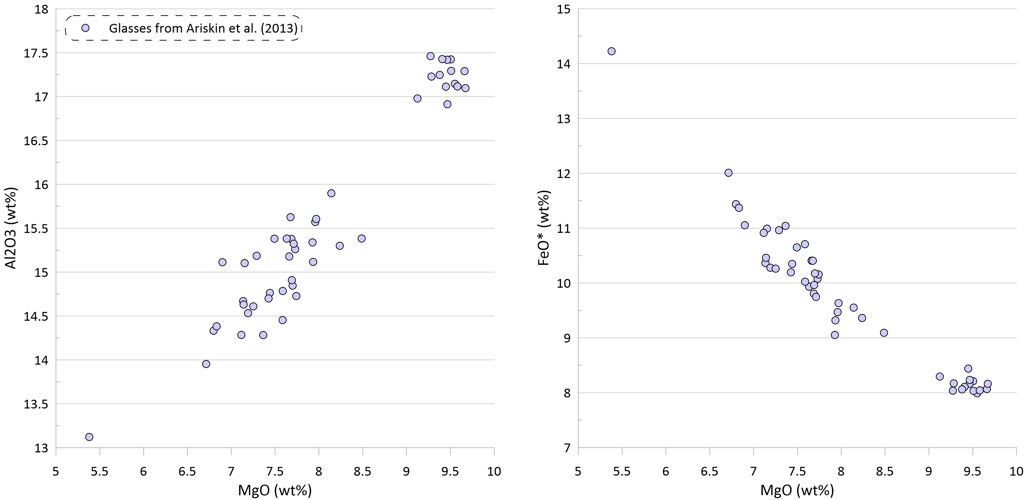
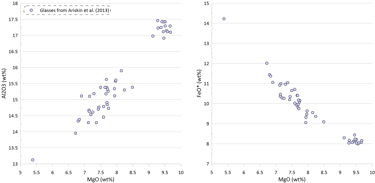
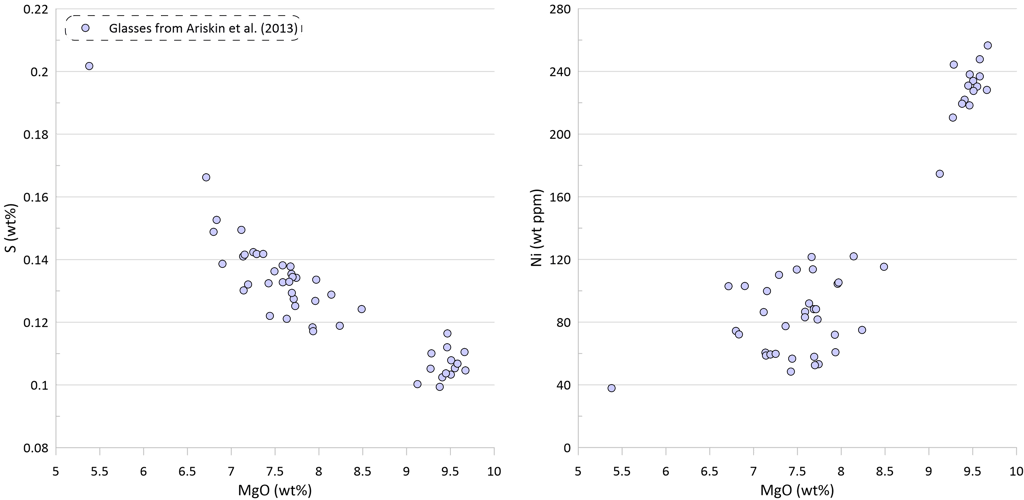
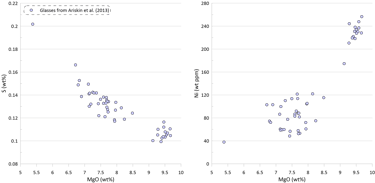
Figure 2. Covariations between major elements, S and Ni in the selected suite of MORB glasses. SiO2, TiO2, Al2O3, FeO* and MgO are shown as examples for the major elements. Sulphur content in the glasses in this and other figures is the total S (reduced + oxidised forms of sulphur).
Modelling of crystallisation demonstrates that the observed trends can be explained by a crystallisation sequence of first olivine alone, followed by an olivine-plagioclase cotectic and then followed by an olivine-plagioclase-clinopyroxene cotectic, a typical crystallising sequence of MORB (Fig. 3). Crystallisation trends shown on Fig. 3 were calculated using mineral melt models of Danyushevsky (2001) for olivine, plagioclase and clinopyroxene. Crystallisation started at 2 kbar pressure. After 30 wt% of crystallisation (at T ~ 1155 C), crystallisation pressure was gradually decreased to 0.5 Kbar for the most fractionated composition, simulating melt ascent towards eruption.
Calculations were performed under conditions of saturation with a CO2-rich fluid using the model of Iacono-Marziano et al. (2012). The H2O content in the melt increased from 0.12 wt% to 0.34 wt% during crystallisation.
The oxidation state of Fe in the melt was modelled assuming a closed system for O. The Fe3/(Total Fe) value in the starting composition was set to 0.089, corresponding to the measured oxidation state of Fe in primitive MORB glasses (Berry et al., 2018; LeVoyer et al., 2019). During crystallisation, the value of Fe3/(Total Fe) increased to 0.12, matching the observed increase in MORB glasses (Berry et al., 2018; LeVoyer et al., 2019). This increase in Fe3/(Total Fe) values corresponds to a change in oxygen fugacity during crystallisation from QFM-1 to QFM-0.3, according to the model of Borisov et al. (2018). Under these reduced conditions, the proportion of oxidised sulphur in the silicate melt is very small, changing from 0.02 mol% to 0.06 mol% following the model of O’Neill and Mavrogenes (2022) or from 0.3 mol% to 0.5 mol% following the model of Nash et al (2019). S contents shown on all plots are total S (reduced + oxidised).
The extent of fractionation of all phases was set to 100% (pure fractional crystallisation). Partitioning of Ni between olivine and silicate melt was calculated using the model of Beattie (1991). Partitioning of sulphur between CO2-rich fluid and silicate melt was calculated using the model of Ding et al. (2023).
Plagioclase joined olivine on the liquidus at T ~ 1192 C after ~ 1.5 wt% of olivine-only crystallisation. Clinopyroxene appeared on the liquidus at T ~ 1163 C after ~ 21.5 wt% of olivine-plagioclase crystallisation.
Note that the sharp decrease in Ni contents with decreasing MgO in the glasses is well explained by crystallisation of an olivine-plagioclase-clinopyroxene assemblage, as Ni is strongly compatible in olivine. At the same time, the observed decrease in Cu contents cannot be explained by the modelled crystallisation trend (Fig. 3).
An additional evidence of sulphide saturation of the glasses is their lower S contents compared to those predicted by modelling crystallisation under an assumption that sulphide saturation is never reached and S only partitions to fluid during crystallisation. Mass-balance calculations assuming that sulphur in the glasses is effectively entirely reduced and taking an average composition of immiscible sulphide globules in MORB glasses suggest that the observed surplus of S along the calculated crystallisation trend can be explained by separation of a maximum of ~ 0.09 wt% of immiscible sulphide when the evolved melt has 5.5 wt% MgO at ~ 1090 oC (Fig. 3). The total extent of crystallisation along the calculated trend at this point is ~ 65 wt%.
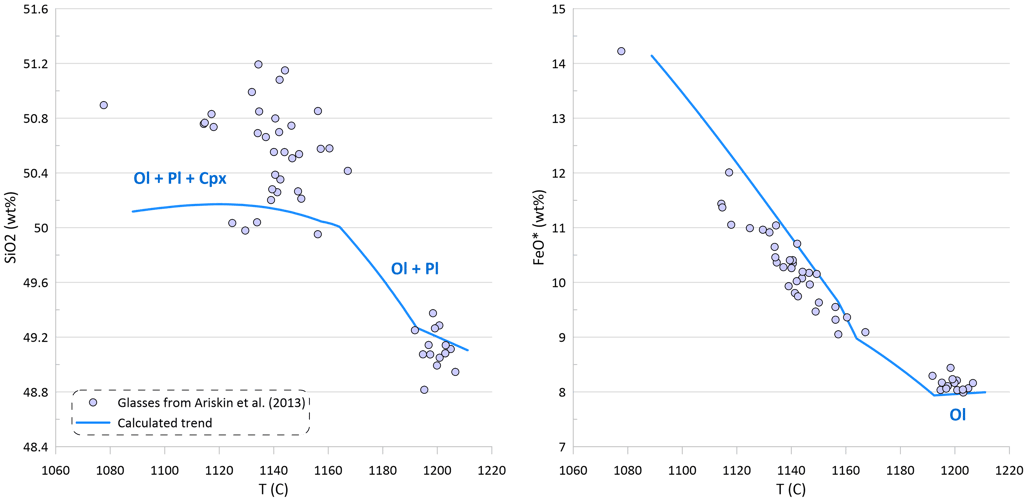
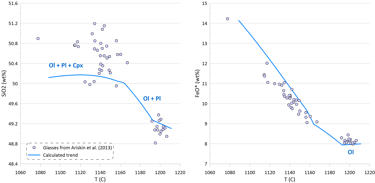
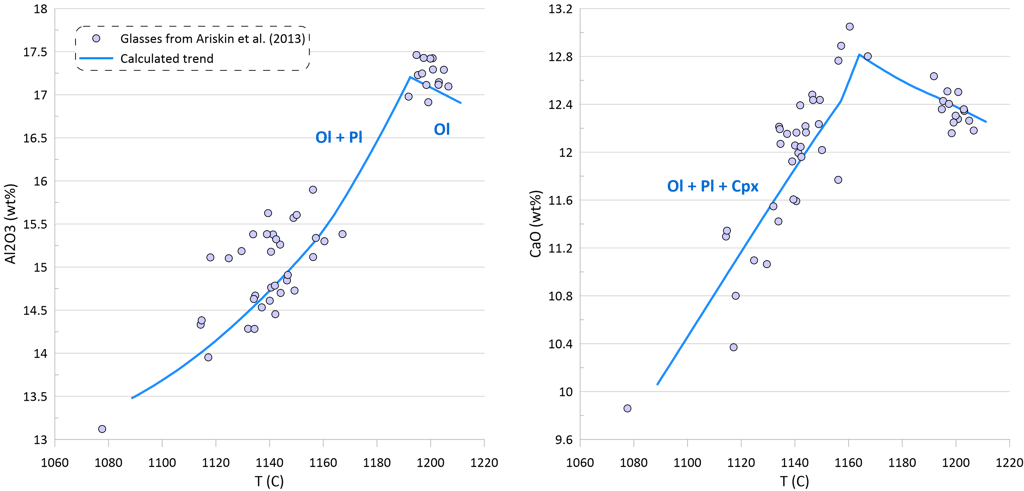
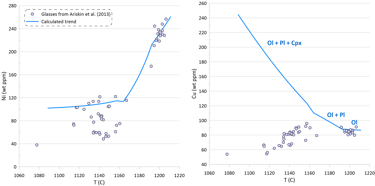
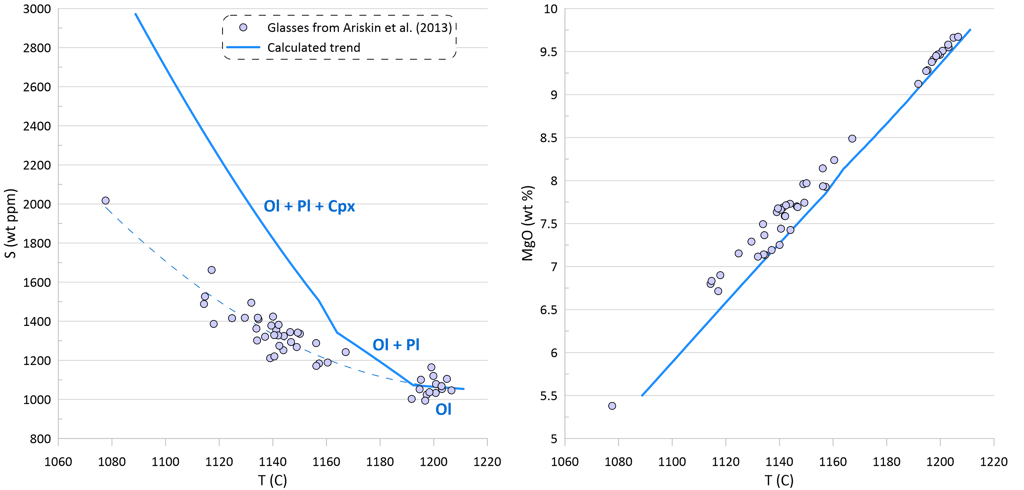
Figure 3. Calculated melt crystallisation trend compared to the observed trends displayed by glass compositions. Temperatures assigned to individual glasses correspond to the olivine liquidus temperature calculated using the model of Danyushevsky (2001). See text for details.
Melt crystallisation trend displayed by the selected suite of MORB glasses
Numerous approaches to describing sulphide solubility (often referred to as sulphur content at sulphide saturation, SCSS) in mafic silicate magmas can be summarised, in a simplified form, by the following relationship:
S = A + (B / T) + C x (P / T) + SUM (Di x (various compositional terms)),
where
S is an expression of sulphur concentration;
T is temperature;
P is pressure;
A, B, C, Di are coefficients of constant values.
Note that in some models more complex terms that describe the effects of temperature and/or pressure may be present.
Fe content of the melt is a prominent part of the compositional terms in all models.
Some of the published models assume equilibrium with a pure Fe sulphide (FeS). The compositional terms in such models also include concentrations of other major elements in the melt and in some cases H2O concentrations in the melt.
SCSS values calculated by models of Wallace and Carmichael (1992), Smythe et al. (2017) and Ding et al. (2018) are dependent on the composition of the equilibrium immiscible sulphide melt, and thus their SCSS values also depend on the chosen model of sulphide melt – silicate melt equilibrium. The models of Wallace and Carmichael (1992) and Smythe et al. (2017) consider the proportion of Fe in equilibrium immiscible sulphide melt, whereas the model of Ding et al. (2018) considers the Ni content in the sulphide melt. The model of Ding et al. (2018) introduces a correction to the calculated SCSS value when Ni content in sulphide is over 8.5 wt%; at lower Ni contents the calculated SCSS value is the same as calculated assuming pure FeS sulphide melt. Note that the SCSS values predicted by both models are not dependent on the Ni and Cu content of the silicate melt.
The compositional terms in O’Neill (2021) include concentrations of Ni and Cu in the silicate melt and do not involve the composition of the equilibrium immiscible sulphide melt.
Unlike melts in experimental studies, the P, T and compositions of natural melts that contain crystals are interdependent. For example:
- during crystallisation of silicate melts, temperature and composition are strongly linked as decreasing temperature causes further crystallisation, leading to changes to the melt composition (Fig. 3). Moreover, the temperature – composition relationship is pressure dependent.
- if a silicate melt rapidly ascends from depths, effectively without crystallisation, P and T both decrease as a result of adiabatic decompression and this change is not linked to the changes in melt composition.
This complicates finding the correct balance between the effects of composition, temperature and pressure, a requirement for successful prediction of SCSS values in natural melts.
Dependence of the calculated values of the SCSS on Fe, Ni and Cu contents in silicate melt
The dependence of SCSS on Fe, Ni and Cu contents in silicate melt, as determined by different models, was assessed by changing the concentration of one element in a relatively unfractionated MORB glass composition, while keeping all other parameters nearly constant (Table 1).
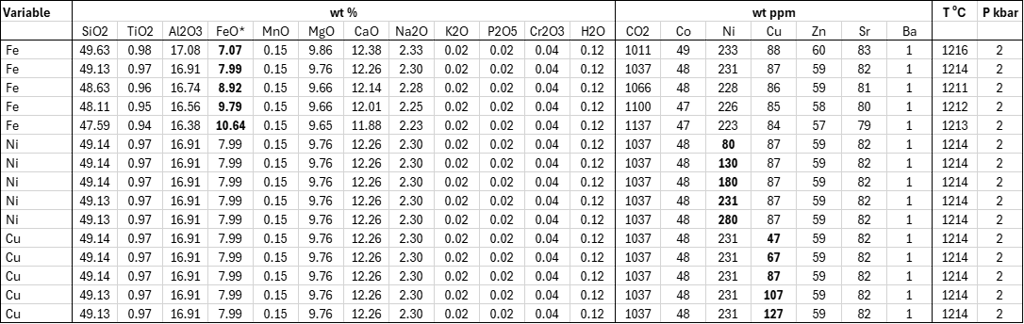
Table 1. Melt compositions used for assessing the dependence of SCSS on Fe, Ni and Cu contents. Liquidus temperatures were calculated using the olivine-melt model of Danyushevsky (2001).
The SCSS values calculated by the models that consider equilibrium with pure FeS are not dependent on the variations in the Ni content of the silicate melt (Fig 4a, values calculated by the models of Fortin et al. (2015) and Ding et al. (2018) are shown as examples).
The SCSS values calculated by the model of O’Neill (2021) decrease with increasing Ni content in the silicate melt at a rate of 93 ppm per a 100-ppm increase in the melt Ni content (Fig. 4a). When the model of Smythe et al. (2017) uses the composition of the equilibrium sulphide melt predicted by the model of O’Neill (2021), it displays a similar dependence of the SCSS on the silicate melt Ni content, with a decrease of 102 ppm per a 100-ppm increase in the melt Ni content (Fig. 4a).
When the model of Smythe et al. (2017) uses the composition of the equilibrium sulphide melt predicted by the model of Kiseeva and Wood (2015), it displays a much stronger dependence of the SCSS on silicate melt Ni content, with a decrease of 270 ppm per a 100-ppm increase in the Ni content (Fig. 4a). Such a strong difference is explained by the differences in the equilibrium immiscible sulphide melt composition calculated by the models of O’Neill (2021) and Kiseeva and Wood (2015), with the compositions predicted by the model of Kiseeva and Wood (2015) being significantly richer in Ni and poorer in Cu.
A similar difference in slopes of the dependence of calculated SCSS values on the Ni content of the silicate melt is observed when the model of Ding et al (2018) is used in combination with sulphide melt compositions predicted by models of O’Neill (2021) and Kiseeva and Wood (2012) (Fig 4a). The model of Ding et al. (2018) predicts a stronger dependence of the SCSS values on the Ni content of silicate melt than the models of O’Neill (2021) and Smythe et al. (2017).
The model of O’Neill (2021) shows a stronger dependence of the SCSS on changes in Cu contents compared to Ni: an increase in Cu content by 10 ppm leads to a decrease in the SCSS by 16 ppm (Fig. 4b). When the model of Smythe et al. (2017) uses the composition of the equilibrium immiscible sulphide melt predicted by the model of O’Neill (2021), it displays a similar dependence of the SCSS on the silicate melt Cu content, with a decrease of 18 ppm per a 10-ppm increase in the Cu content (Fig. 4b).
The model of Smythe et al. (2017) shows a very minor decrease in SCSS with increasing Cu content when it uses the composition of the equilibrium immiscible sulphide melt predicted by the model of Kiseeva and Wood (2015), with a decrease of 1.90 ppm per a 10-ppm increase in the silicate melt Cu content (Fig. 4b).
Unlike models of O’Neill (2021) and Smythe et al. (2017), the model of Ding et al. (2018) shows an increase in SCSS with increasing Cu contents in silicate melt (Fig. 4b). This is because increasing melt Cu contents lead to a decrease in Ni contents in the calculate equilibrium immiscible sulphide melt, which in turn results in an increase in the calculated SCSS, as the model of Ding et al. (2018) only considers the Ni content of the equilibrium sulphide melt.
Although all models reveal a positive correlation between the FeO* content in the silicate melt and the calculated value of SCSS (Fig. 4c), this effect is smaller for models that consider equilibrium with pure FeS (~ 80 ppm per 1 wt% change in FeO content of the silicate melt) compared to the models that also incorporate Ni and Cu (~ 105- 125 ppm per 1 wt% change in FeO content of the silicate melt).
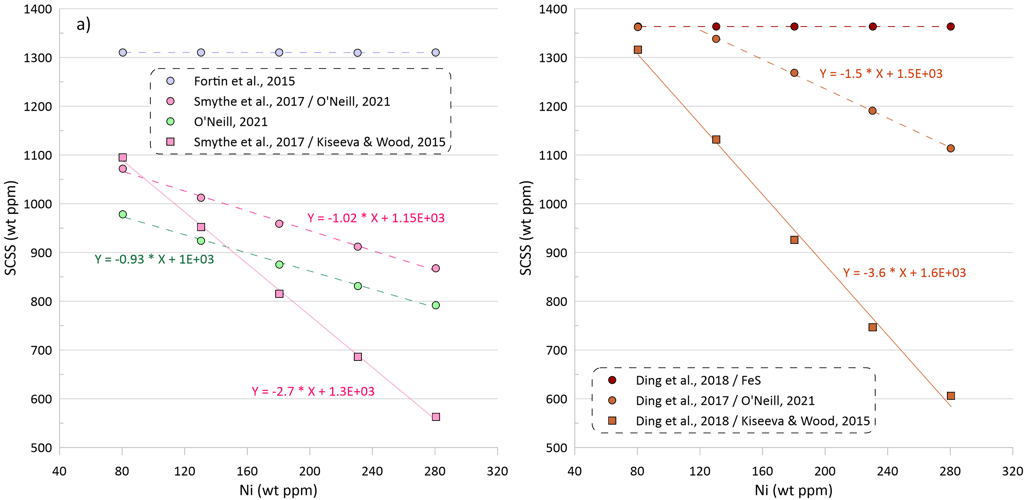
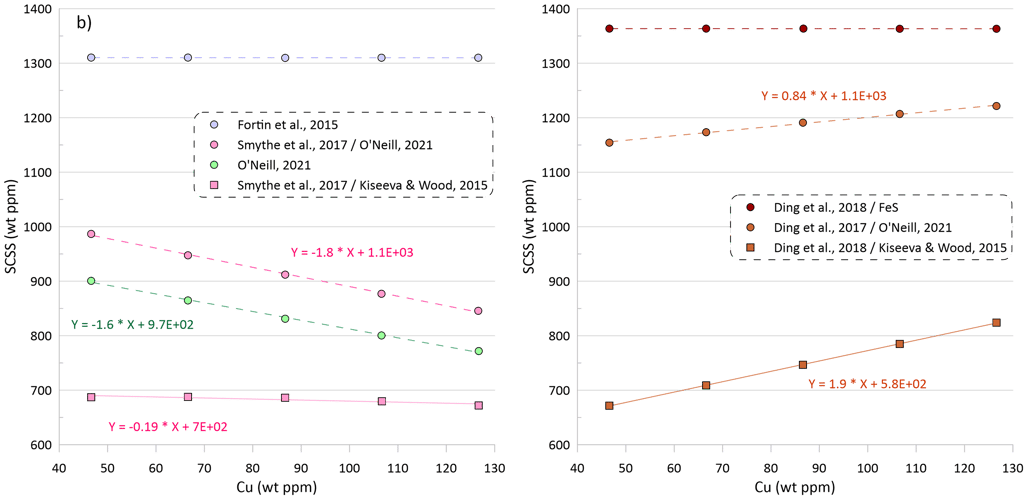
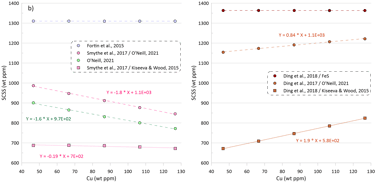
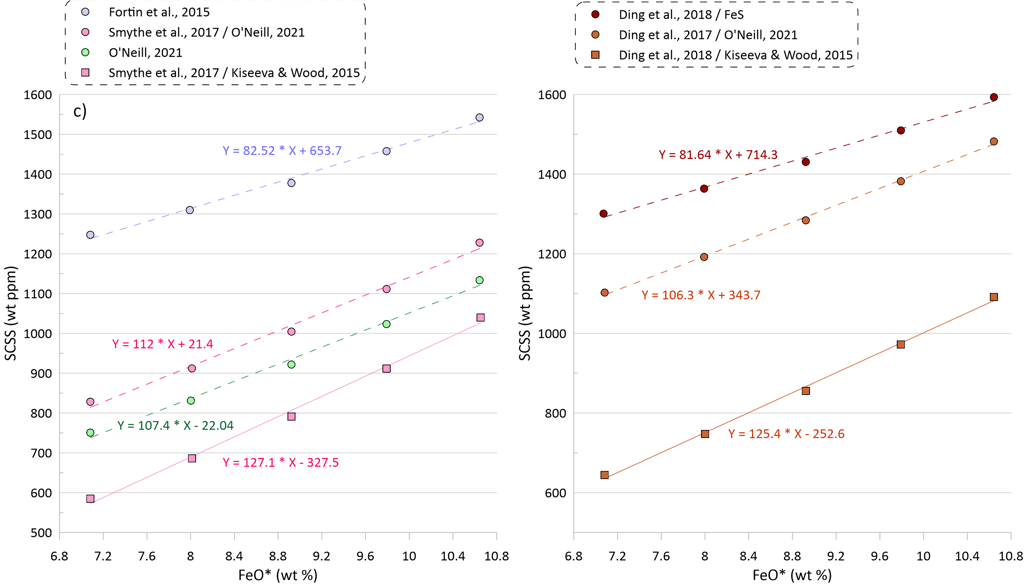
Figure 4. Dependence of SCSS values on Ni, Cu and Fe contents in the silicate melt. Note that the dependences of the SCSS on melt Ni, Cu and Fe contents in all models are not linear, but they have been interpolated by linear trends for the intervals shown on this figure for clarity. These dependences should not be extrapolated beyond the compositional intervals shown on the figure as they would not hold. See text for details.
Predicting S contents of sulphide-saturated MORB glasses
The predicted SCSS as calculated by all available models for all glasses are shown on Figure 5. Glasses with the lowest FeO* contents are least fractionated and are characterised by the highest temperatures, MgO, Ni and Cu contents (Figs. 2 and 3). Liquidus temperatures were determined using the olivine-melt model of Danyushevsky (2001) for hydrous calculations (Figs 5a, 5b) and using the model of Ford et al. (1983) for anhydrous calculations (Figs 5c, d). Oxygen fugacity followed the QFM buffer in all calculations. The oxidation state of Fe was determined using the model of Borisov et al. (2018). Pressure was set at 0.1 kbar.
Calculations taking into account the effect of H2O on crystallisation temperature.
Models that consider equilibrium with pure FeS (Li and Ripley, 2005, 2009; Fortin et al., 2015; and Wallace and Carmichael, 1992 and Ding et al., 2018 when paired with pure FeS sulphide) are unable to reproduce the observed continuous increase in S contents with increasing FeO content (Fig. 5a). Li and Ripley (2009), Fortin et al. (2015) and Ding et al. (2018) show very similar results with similar SCSS values across all glasses. As a result, the calculated SCSS of less evolved glasses are higher than the measured concentrations by 200-400 ppm, whereas the calculated values are lower for the evolved low-temperature glasses by 600 – 800 ppm (Fig. 5a). The models of Wallace and Carmichael (1992) and Li and Ripley (2005) shows a similar trend but at lower S contents thus reproducing the measured S contents in the less evolved glasses and very substantially underestimating S contents in the evolved glasses (by up to ~ 1400 ppm, Fig 5a). One of the reasons that these models do not reproduce the observed increase in S contents during crystallisation is that they do not account for the effect of Ni and Cu on decreasing the SCSS values: the less evolved high-temperature glasses have high Ni and Cu contents that lead to lower SCSS values. On the other hand, these models cannot reproduce the high S contents in the evolved glasses with low Ni and Cu contents due to relatively lower dependence of the predicted SCSS on the melt Fe content (Fig. 4). This is illustrated by calculating the SCSS using the models of Smythe et al. (2017) and O’Neill (2021) assuming that Cu and Ni content in the glasses are 0 (Fig 5a). The latter two models then predict even higher SCSS values for the less evolved high-temperature glasses that have high Ni and Cu contents (i.e., they predict overall higher S contents glasses), but they also show a stronger increase in the SCSS with increasing Fe in the most evolved glasses.
The model of Smythe et al. (2017) paired with the sulphide melt compositions after Kiseeva and Wood (2015) reproduces the slope of the S-FeO correlation, however it predicts significantly lower S contents (by ~ 400 ppm; Fig. 5b). The SCSS values predicted by O’Neill (2021) and Smythe et al. (2017) paired with the sulphide melt compositions after O’Neill (2021) are much closer to the measured values in less evolved high-temperature glasses with high Ni and Cu contents (lower by 100-150 ppm compared to the measured values). However, the predicted slope of the S-FeO correlation is shallower, leading to a progressively larger difference with increasing extent of crystallisation and reaching ~ 400 ppm for the most evolved glasses (Fig. 5b).
When the models of Ding et al. (2018) and Wallace and Carmichael (1992) are paired with models of sulphide melt that include Ni and Cu, the resulting pattern of the calculated SCSS values displays significantly lower SCSS values for the least evolved glasses, similar to those produced by the models of Smythe et al. (2017) and O’Neill (2021) (Fig 5b). However, the results for the most evolved glasses are effectively identical to the calculations with pure FeS, significantly underestimating their S contents due to an insufficient dependence of the calculated SCSS on the melt Fe content. When Ding et al. (2018) and Wallace and Carmichael (19921) are paired with Kiseeva and Wood (2015) sulphide model, the predicted SCSS values are lower than when they are paired with O’Neill (2021), as Kiseeva and Wood (2015) model predicts higher Ni contents and lower proportions of FeS in the immiscible sulphide melt than the model of O’Neill (2021).
Anhydrous calculations.
If we assume that the small amounts of H2O present in the glass do not affect crystallisation temperatures of the glass compositions, the obtained SCSS values show the same patterns, but at higher values due to the positive effect of temperature on the SCSS (Figs. 5c, d). The difference in the estimated liquidus temperature between these alternative scenarios is ~ 25-30 oC for the less evolved glasses, gradually increasing to ~ 50 oC for the most evolved glasses (Fig 5e).
The effect of temperature varies between the models (c.f. Figs. 5a,b and 5c,d). The SCSS values predicted by O’Neill (2021) and Smythe et al. (2017) paired with the sulphide melt compositions after O’Neill (2021) in anhydrous calculations produce a better match to the measured S contents of the glasses (Fig. 5d). However, this is unlikely to indicate that the ‘anhydrous’ temperatures are a better estimate of the crystallisation temperature, as the crystallisation trends calculated ignoring the H2O contents in the glasses produce a much poorer fit to the trends displayed by the glass compositions (Fig. 5f).
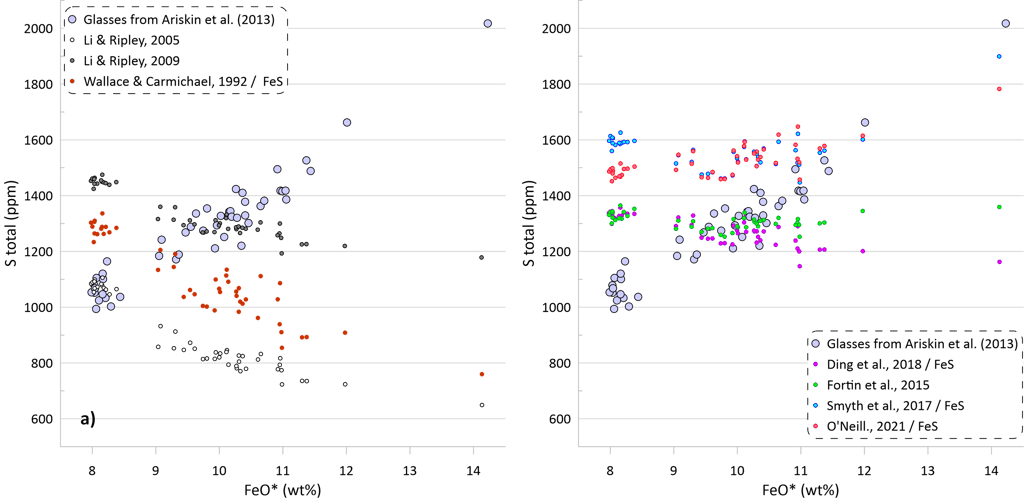
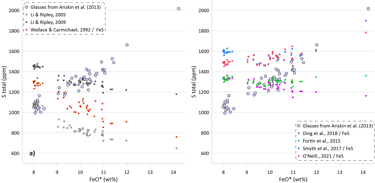
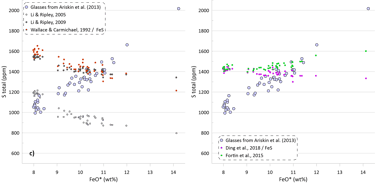
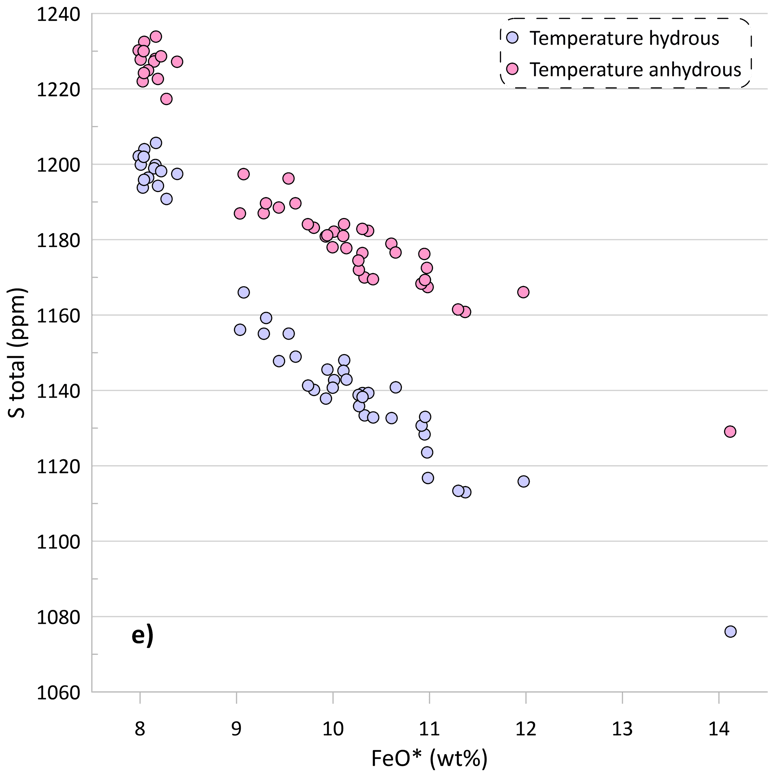
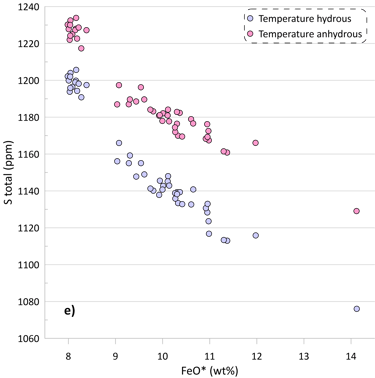
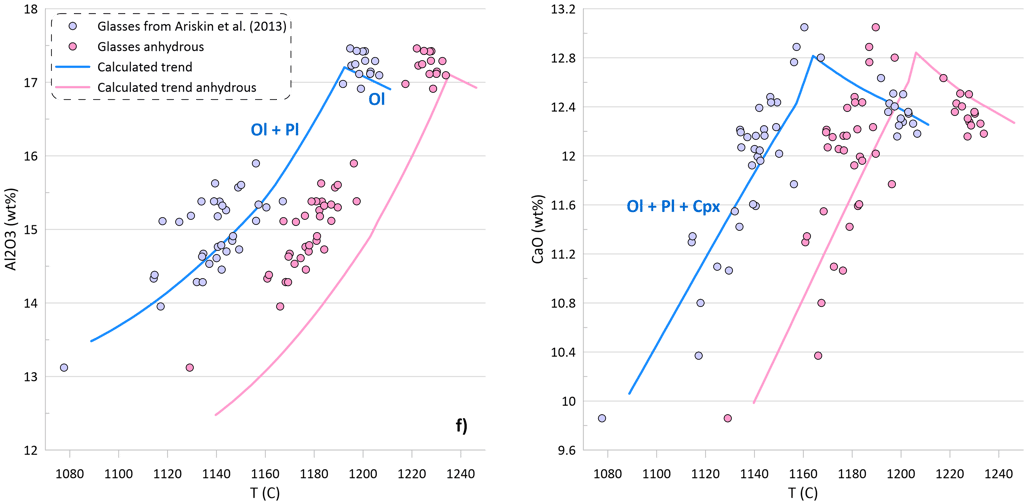
Figure 5. SCSS values calculated by the available sulphide-saturation models compared to the measured values. Values calculated taking into account the measured H2O contents of the glasses are shown on Figs. 5a, b. Values calculated assuming that the glass compositions are anhydrous are shown on Figs. 5c, d. The difference between hydrous and anhydrous temperatures is shown on Fig. 5e. The crystallisation trend calculated assuming that the glass compositions are anhydrous is compared to the hydrous trends (from Fig. 3) on Fig. 5f (Al2O3 and CaO contents are shown as examples).
The impact of models of sulphide saturation and sulphide composition on the calculated crystallisation trends for S, Ni and Cu
To assess the impact of the available models of sulphide saturation and sulphide composition on the calculated crystallisation trends, crystallisation was modelled using the same conditions as for the trends shown on Fig.3, but assuming sulphide saturation. Crystallisation trends for S, Ni, and Cu are shown on Fig. 6 for models that assume equilibrium with pure FeS. As discussed above with respect to Fig. 5, these models cannot reproduce the observed increase of S contents and decrease in Cu contents during crystallisation. The observed fast decrease in Ni contents during olivine-only and olivine + plagioclase crystallisation is due to olivine removing Ni from the melt. When clinopyroxene appears on the liquidus at ~ 8.2 wt% MgO, the predicted decrease of Ni slows down as olivine constitutes only a minor part of the crystallising assemblage along an olivine-plagioclase-clinopyroxene cotectic. All four models predict a similar amount of sulphide melt: 0.210 wt% after Li and Ripley (2009); 0.190 wt% after Ding et al. (2018) and Wallace and Carmichael (1992); 0.176 wt% after Li and Ripley (2005) and 0.172 after Fortin et al. (2015). Note that the amounts of immiscible sulphide predicted by these models are ~ 2 times higher than what was estimated based on the differences between the calculated sulphide-free crystallisation trend and the observed glass compositions (Fig. 3). This is because these models cannot not reproduce the observed increase in S contents during crystallisation, and thus require removal of a larger amount of immiscible sulphide melt.
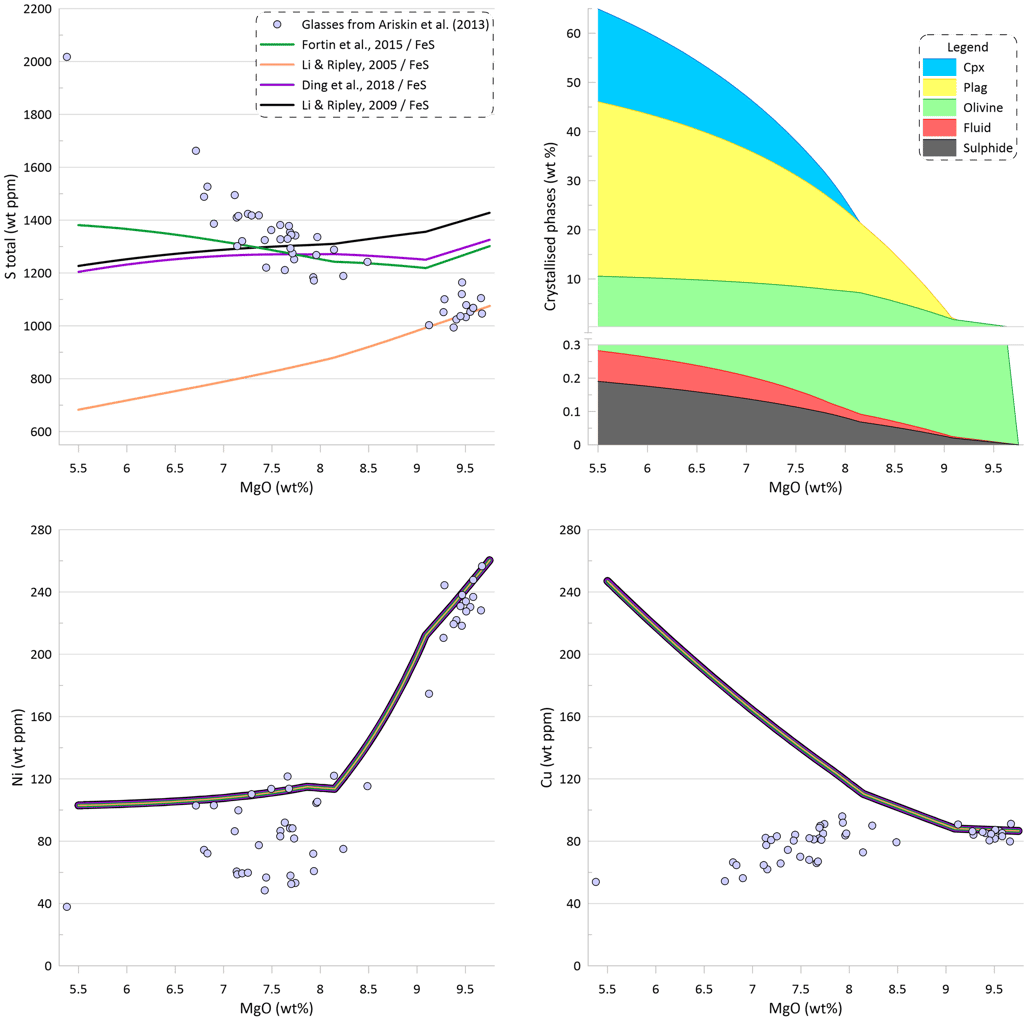
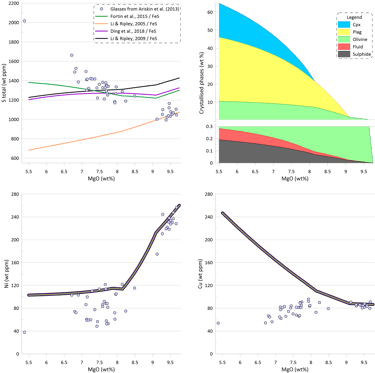
Figure 6. Melt crystallisation trends calculated assuming sulphide saturation using the models of Li and Ripley (2005, 2009); Fortin et al. (2015; and Ding et al., 2018 when paired with pure FeS sulphide. Note that these models predict nearly identical trends for Ni and Cu. Proportions of crystallising phases are shown for calculations using the model of Ding et al. (2018).
Melt crystallisation trends obtained when using sulphide saturation models of O’Neill (2021) and Smythe et al. (2017) paired with the sulphide melt compositions after O’Neill (2021) are very similar (Fig. 7). These models reproduce the observed increase in S contents and decrease in Cu contents during crystallisation, however the predicted S contents are lower than those measured in the glasses, as discussed above with regards to Fig. 5. Both models predict similar amounts of the immiscible sulphide melt that are significantly lower than the amounts produced with models involving pure FeS (Fig 6): 0.059 wt% for O’Neill (2021) and 0.060 wt% for Smythe et al. (2017) paired with the sulphide melt compositions after O’Neill (2021). Note that the amounts of immiscible sulphide predicted by these models are ~ 65% of what was estimated based on the differences between the calculated sulphide-free crystallisation trend and the observed glass compositions (Fig. 3). This is because these models predict lower SCSS values thus requiring removal of a smaller amount of immiscible sulphide melt to produce a similar slope of the S-FeO correlations to that defined by the glasses.
Until clinopyroxene appears on the liquidus at ~8.2 wt% MgO, there is very little impact of sulphide immiscibility on the Ni content of the silicate melt, as the budget of Ni is controlled by olivine. However, after clinopyroxene joins the crystallising assemblage and the proportion of olivine decreases, separation of immiscible sulphide leads to a continuing decrease of Ni in the silicate melt, matching well the observed trend in the glasses. Both models reproduce well the observed trend of decreasing Cu contents in the glasses after clinopyroxene appears on the liquidus.

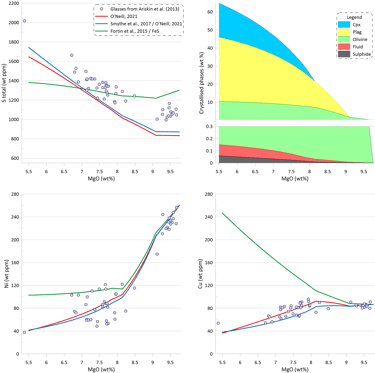
Figure 7. Melt crystallisation trends calculated assuming sulphide saturation using the models of O’Neill (2021) and Smythe et al. (2017) paired with the sulphide melt compositions after O’Neill (2021). The trend calculated assuming sulphide saturation using the model of Fortin et al. (2015) from Fig. 6 is shown for comparison. Proportions of crystallising phases are shown for calculations using the model of O’Neill (2021).
Melt crystallisation trends obtained when using the sulphide saturation model of Smythe et al. (2017) paired with the sulphide melt compositions after Kiseeva and Wood (2015) is substantially different (Fig. 8). The interplay between 1) an increase in the melt S and Cu contents due to crystallisation of silicates, and 2) the decrease in the Ni content in the melt due to crystallisation of olivine, leads to a situation where after the initial sulphide saturation of the starting composition, the crystallising melt remains sulphide undersaturation until the saturation is reached again at ~ 7.7 wt% MgO. This is a result of the changes to the composition of the immiscible sulphide melt as predicted by Kiseeva and Wood (2015) affecting the predicted SCSS values calculated by Smythe et al. (2017).
Until the saturation is reached again, the trends of Ni and Cu follow those for silicate-only (or with saturation in pure FeS) crystallisation (Fig. 8), with S and Cu contents in the melt increasing due to silicate crystallisation (i.e., S and behave as other incompatible elements). Once sulphide saturation is reached, Ni and Cu in the silicate melt decrease similarly to the trends shown on Fig. 7. As a result, the amount of immiscible sulphide predicted by the model of Smythe et al. (2017) paired with the sulphide melt compositions after Kiseeva and Wood (2015) is substantially lower compared to other models: 0.022 wt% (Fig. 8).
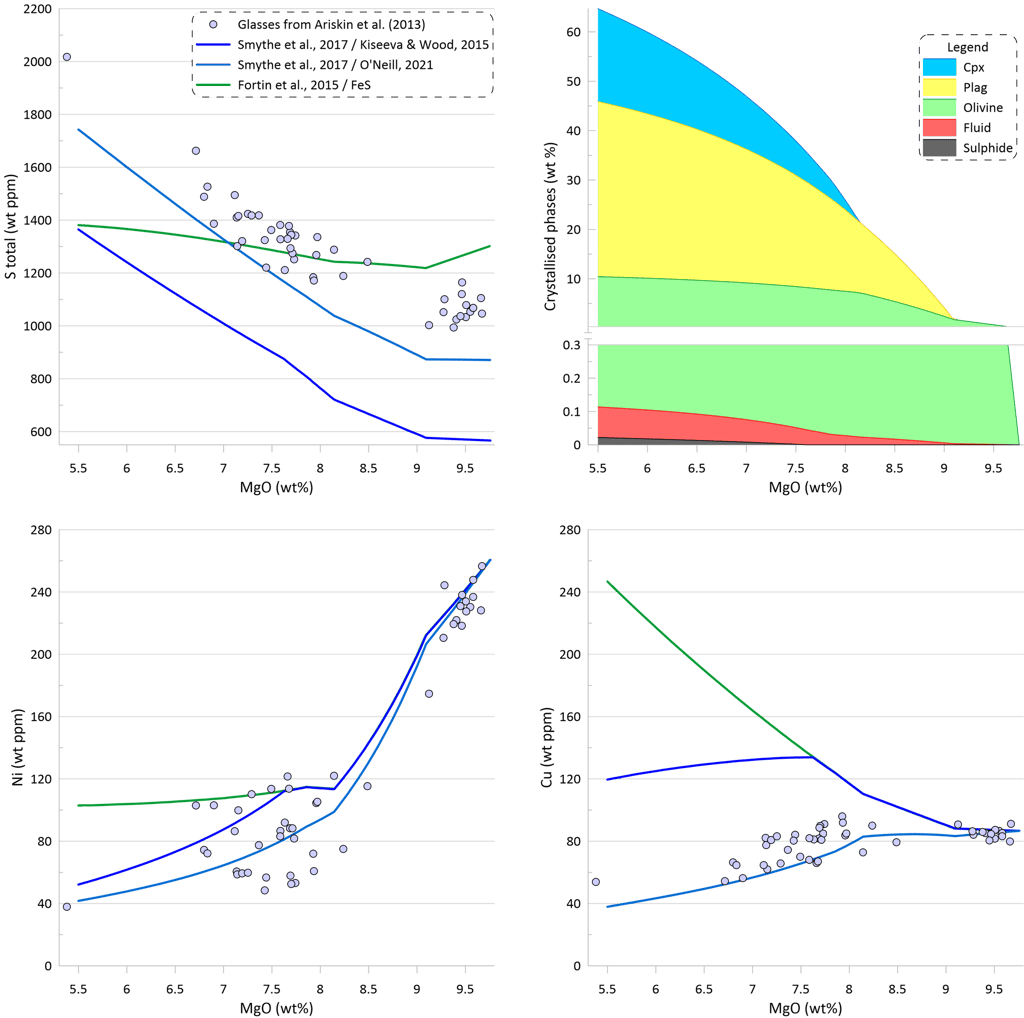

Figure 8. Melt crystallisation trends calculated assuming sulphide saturation using the model of Smythe et al. (2017) paired with the sulphide melt compositions after Kiseeva and Wood (2015). The trends calculated assuming sulphide saturation using the models of Fortin et al. (2015) from fig. 6 and Smythe et al. (2017) paired with the sulphide melt compositions after O’Neill (2021) from Fig. 7 are shown for comparison. Proportions of crystallising phases are shown for calculations using the model of Smythe et al. (2017) paired with the sulphide melt compositions after Kiseeva and Wood (2015).
The effect of immiscible sulphide composition on the silicate melt crystallisation trend can be assessed by pairing the sulphide solubility model of O’Neill (2021) with different sulphide compositions, as the sulphide solubility model of O’Neill (2021) predicts the SCSS values based on the silicate melt composition only (Fig. 9). There are essentially identical trends of increasing S content during crystallisation when the composition of the immiscible sulphide melt is calculated either using the O’Neill (2021) model or the Kiseeva and Wood (2015) model. However, the trend produced when using the Kiseeva and Wood (2015) model has lower Ni and higher Cu contents at a given MgO, reflecting the difference in the predicted compositions of the immiscible sulphide melt (the compositions predicted by the Kiseeva and Wood (2015) model are richer in Ni and poorer in Cu). Both calculations produce a similar amount of the immiscible sulphide melt: 0.059 wt% when sulphide melt is from O’Neill (2021) and 0.061 wt% when sulphide melt is from Kiseeva and Wood (2015) (c.f., Figs. 6 and 9).
When the Model of O’Neill (2021) is pared with pure Fes, the predicted increase in S contents during crystallisation is much smaller. This is because the increasing Cu contents and higher Ni contents of the evolving silicate melt lead to lower predicted SCSS values during crystallisation (Fig. 9).
On the other hand, when the model of Fortin et al. (2015) is paired with the composition of the immiscible sulphide melt predicted by the O’Neill (2021) model, the resulting trend shows a much steeper decrease in Ni and Cu contents of the silicate melt than what is observed in the glasses. This is because the model of Fortin et al. (2015) predicts a significantly larger amount of immiscible sulphide (see Fig. 6). The amount of immiscible sulphide predicted by this calculation (0.180 wt%) is similar to the amount produced for pure FeS sulphide (Fig. 6). Similar trends are obtained when using models of Li and Ripley (2005, 2009).
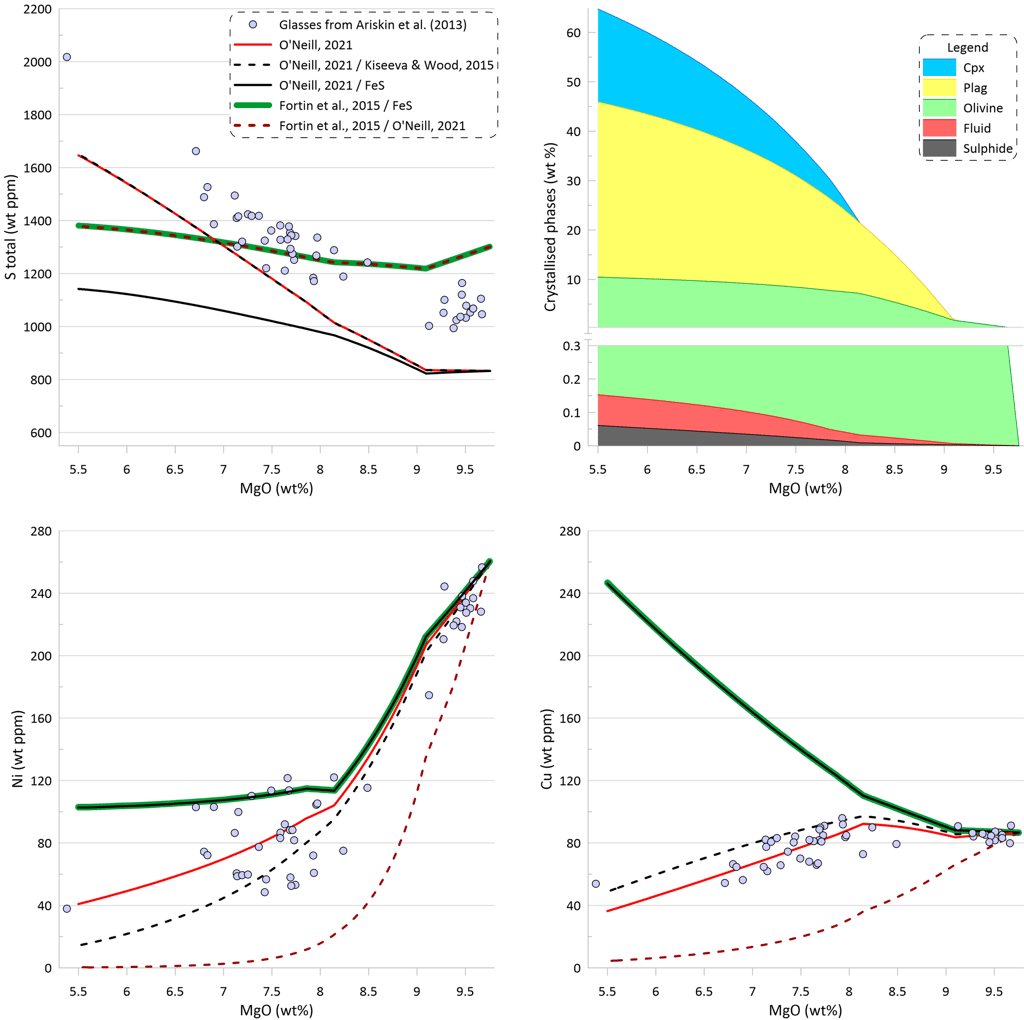
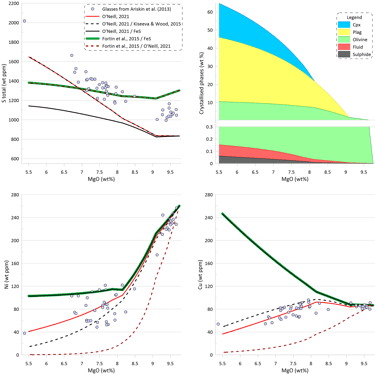
Figure 9. Melt crystallisation trends calculated assuming sulphide saturation using the model of O’Neill (2021) paired with the sulphide melt compositions after O’Neill (2021), after Kiseeva and Wood (2015), and pure FeS. Also shown are trends calculated assuming sulphide saturation using the model of Fortin et al. (2015) paired with pure FeS and with the sulphide melt compositions after O’Neill (2021). Proportions of crystallising phases are shown for calculations using the model of O’Neill (2021) paired with the sulphide melt compositions after Kiseeva and Wood (2015).
The above comparisons show that models that incorporate Ni and Cu do a much better job at predicted the observed variation in S, Ni and Cu contents in variably evolved sulphide-saturated MORB glasses, although all are underestimating glass S contents to a variable extent.
If modelling of crystallisation was performed at more oxidised conditions the predicted total sulphur contents in the silicate melt would be higher due to a higher proportion of the oxidised sulphur in the silicate melt (Fig. 10). Changing the Fe3/(Total Fe) value in the starting composition from 0.089 to 0.135 would lead to its increase to 0.181 during crystallisation. This increase in Fe3/(Total Fe) values corresponds to a change in oxygen fugacity during crystallisation from QFM to QFM+0.7, according to the model of Borisov et al. (2018). The proportion of oxidised sulphur would increase to ~ 11% in the starting composition and to ~ 19% at the end of crystallisation, resulting in the total sulphur concentrations matching well the observed glass S contents.
However, such high values of Fe3/(Total Fe) are well above the measured oxidation state of Fe in MORB glasses (Berry et al., 2018; LeVoyer et al., 2019). Note also that the model of Borisov et al. (2018) predicts higher oxygen fugacity for a given melt composition than most other models. Thus, choosing a different melt oxidation model would require even higher values of Fe3/(Total Fe) to obtain similar total S contents. Moreover, the model of Nash et al. (2019) predicts higher proportions of oxidised sulphur than the model of O’Neill and Mavrogenes (2022). Thus using the latter model would require again higher values of Fe3/(Total Fe) to obtain similar total S contents.
It thus appears unlikely that discrepancy between the modelled and observed S contents in MORB glasses can be explained by the presence of a significant proportion of oxidised sulphur.
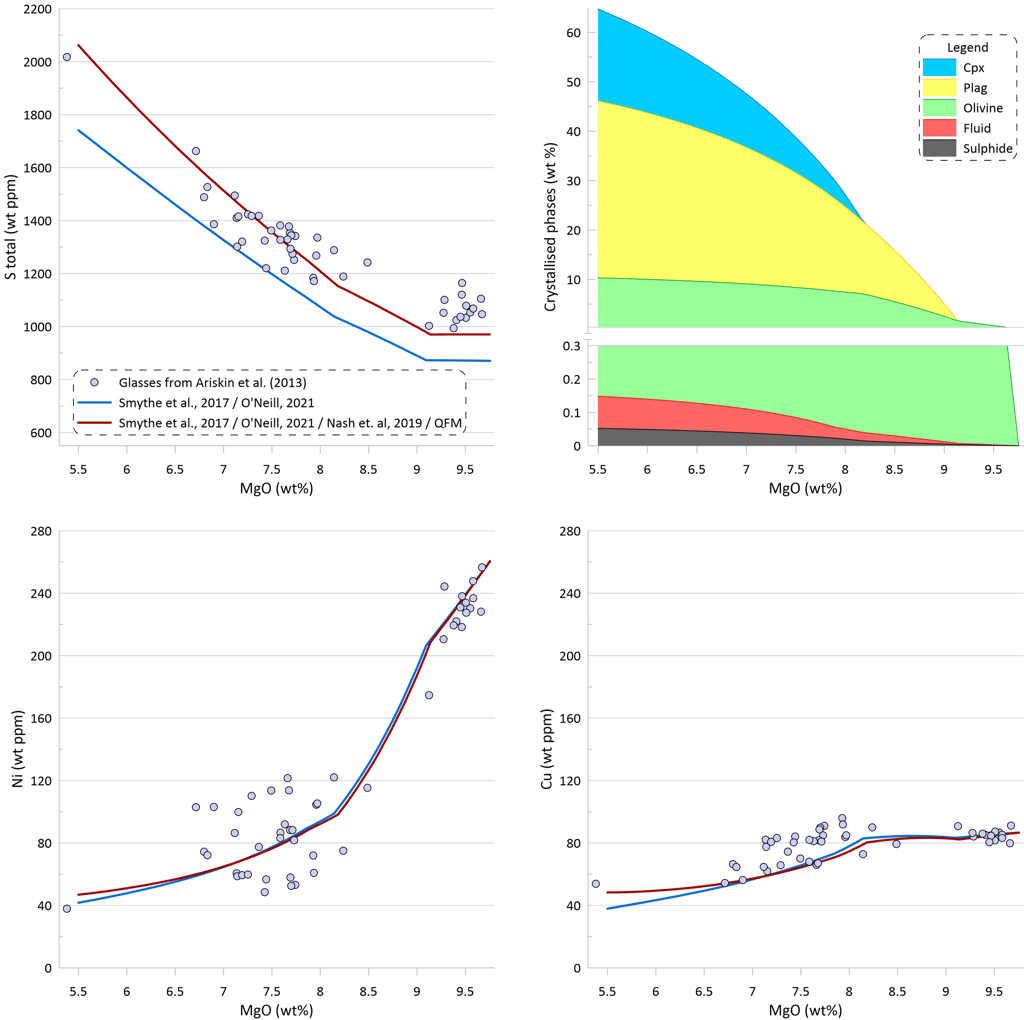
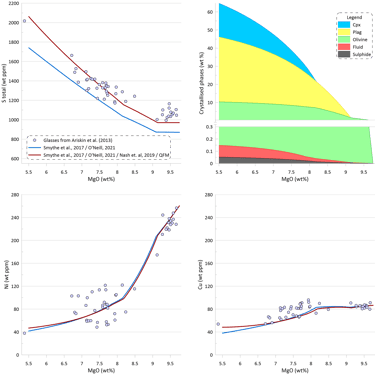
Figure 10. Melt crystallisation trends calculated assuming sulphide saturation in more oxidised conditions using the model of Smythe et al. (2017) paired with the sulphide melt composition after O’Neill (2021) and the model of Nash et al. (2019) for S oxidation state in the melt. Also shown is the trend calculated assuming sulphide saturation using the model of Smythe et al. (201) paired with the sulphide melt compositions after O’Neill (2021) from Fig. 7. Proportions of crystallising phases are shown for calculations using sulphide saturation in more oxidised conditions using the model of Smythe et al. (2017) paired with the sulphide melt composition after O’Neill (2021) and the model of Nash et al. (2019) for S oxidation state in the melt.
In summary, the choice of the sulphide solubility and sulphide composition models used in calculations may have a significant impact on the inferred timing of sulphide saturation, the calculated amount of immiscible sulphide, and the calculated trends of S, Ni and Cu contents during crystallisation. Similar assessments of models’ performance for compositions of other common magma types requires similarly well constrained and well-characterised suites of variably evolved samples representing single liquid lines of descent.